

The Pandemic of Excess Fat
Rates of Obesity in the United States
The rate of obesity in the United States is increasing at an alarming rate and has profound implications for public health. To get a sense of how fast, watch this animation from the CDC data on obesity rates from 2011 to 2021.

Obesity rates vary considerably by state. The state of Mississippi has the highest rate of obesity at 40.8 percent, and Colorado is the lowest at 23.8 percent. Twelve states now have obesity rates over 35 percent. For perspective, in 2000, no state had an obesity rate above 25 percent.
There is also variation in obesity rates by socioeconomic status. In general, the more people earn, the less likely they are to obese. Higher education is also associated with lower rates of obesity. Those who live in rural communities are more likely to have obesity than those who live in suburban or metro areas.
How is Obesity Measured?
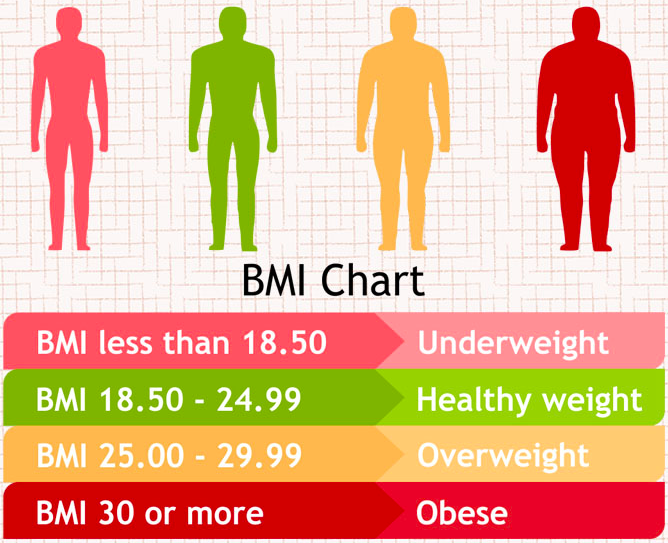
In population studies, obesity is defined as a Body Mass Index (BMI) over 30.
Body Mass Index is calculated by dividing one’s weight (in kg) by the square of one’s height (in m2).
The standard classification of Obesity is based upon the Consultation on Obesity convened by the World Health Organization in 1997.
Obesity was defined as a BMI of 30.0 or greater. Further classification of obesity was made as follows:
- BMI 30.0-34.9 — Class I obesity
- BMI 35.0-39.9 — Class II obesity
- BMI 40.0 or greater — Class III obesity
Obesity in Adults
Based on BMI data, the obesity rate among adults is now 41.8% based on data from 2017-2020, up from 36.0% in 2013-2016.
Note that the most recent data was prior to the 2020-2022 period that was characterized by socioeconomic stress and isolation. There is already data showing significant worsening of metabolic health during this period, and the long-term consequences will be ongoing.
It is estimated that 51% of the world’s population will be overweight or obese (by BMI) by the year 2035, a sharp rise from 38% of the world’s population in 2020. That 2035 projection includes an estimated 24% rate of obesity worldwide, up from 14% in 2020.
Obesity in Children
The problem with obesity is not limited to adults. According to the 2017-2020 data, obesity affected 19.7% of children and adolescents aged 2-19 years. That is an increase from 17.8% from 2013-2016 data.
The health implications of obesity in children are mostly the same as in adults, but with a risk of developing complications at an earlier stage in life. This earlier risk unfortunately translates to increased mortality. It is now predicted that children today are the first generation that is expected not to outlive their parents.
A Better Measure of Metabolic Risk
Because of the significant  limitations of the BMI in representing true overweight or obesity, it is more helpful to think in terms of body fat. Body fat is much more relevant to the development of metabolic complications and physical impairment. This measure captures individuals who may be of normal weight but have excess fat associated with poor health – what’s colloquially referred to as “skinny-fat”.
When measuring body fat more accurately (by direct measurement, such as by DEXA, or by indirect measurement, such as waist-to-height ratio), a more daunting reality emerges.
It is estimated that 91% of adults in the United States can be classified as overfat, along with 69% of children.
A Pandemic of Poor Metabolic Health
As concerning as the data are regarding rates of obesity in the United States (and World), the conventional measure (BMI) significantly under-estimates the true burden of metabolic disease. With 91% of adults meeting criteria for “overfat”, we are facing a true pandemic of poor metabolic health.